
Another year, another overview of my collection. This is still one of my favorite posts of the year. Based on metrics, you all seem to prefer the “highlights” infographics version of this that I did last year over the in-depth dashboards I’ve put together previously. So, I stuck with that style.
For anyone who needs, or wants, an accessible version of the graphics below, I put together a text-only PDF version of this post. I’ve also made sure that the most important data in the graphics is also in the text of this post. So, you can choose the method of reading this post that most appeals to you: text, graphics, or PDF.
A quick note before I get started: click any of the below images to view them larger.
Collection Overview
Here’s a quick overview of my current fountain pen collection.
I currently own 190 pens.
- 160 of them are my “active collection”
- 139 are in active use
- 7 are in review to possibly sell
- 12 are retired, but kept for sentimental or collectability reasons
- 1 is decommissioned
- 1 is my “vacation” pen, only used for travel
- 30 of them are not in my possession or on their way out
- 1 is out for aftermarket customization
- 4 are with Jim
- 25 are for sale
- 2 additional pens are pending
- 1 commissioned, still in progress
- 1 not yet arrived
Collection Timeline
I didn’t include a timeline last year, but I always find it fascinating to see how my collection has evolved over the years. I separated out rollerball (RB) and Ballpoint (BP) pens from fountain pens (FP) since I treat them as separate, but linked, collections. Each year has the collection size at the start of the year, additions — purchases and gifts — deductions — sales, gifts, donations, etc. — and collection size at the end of the year.
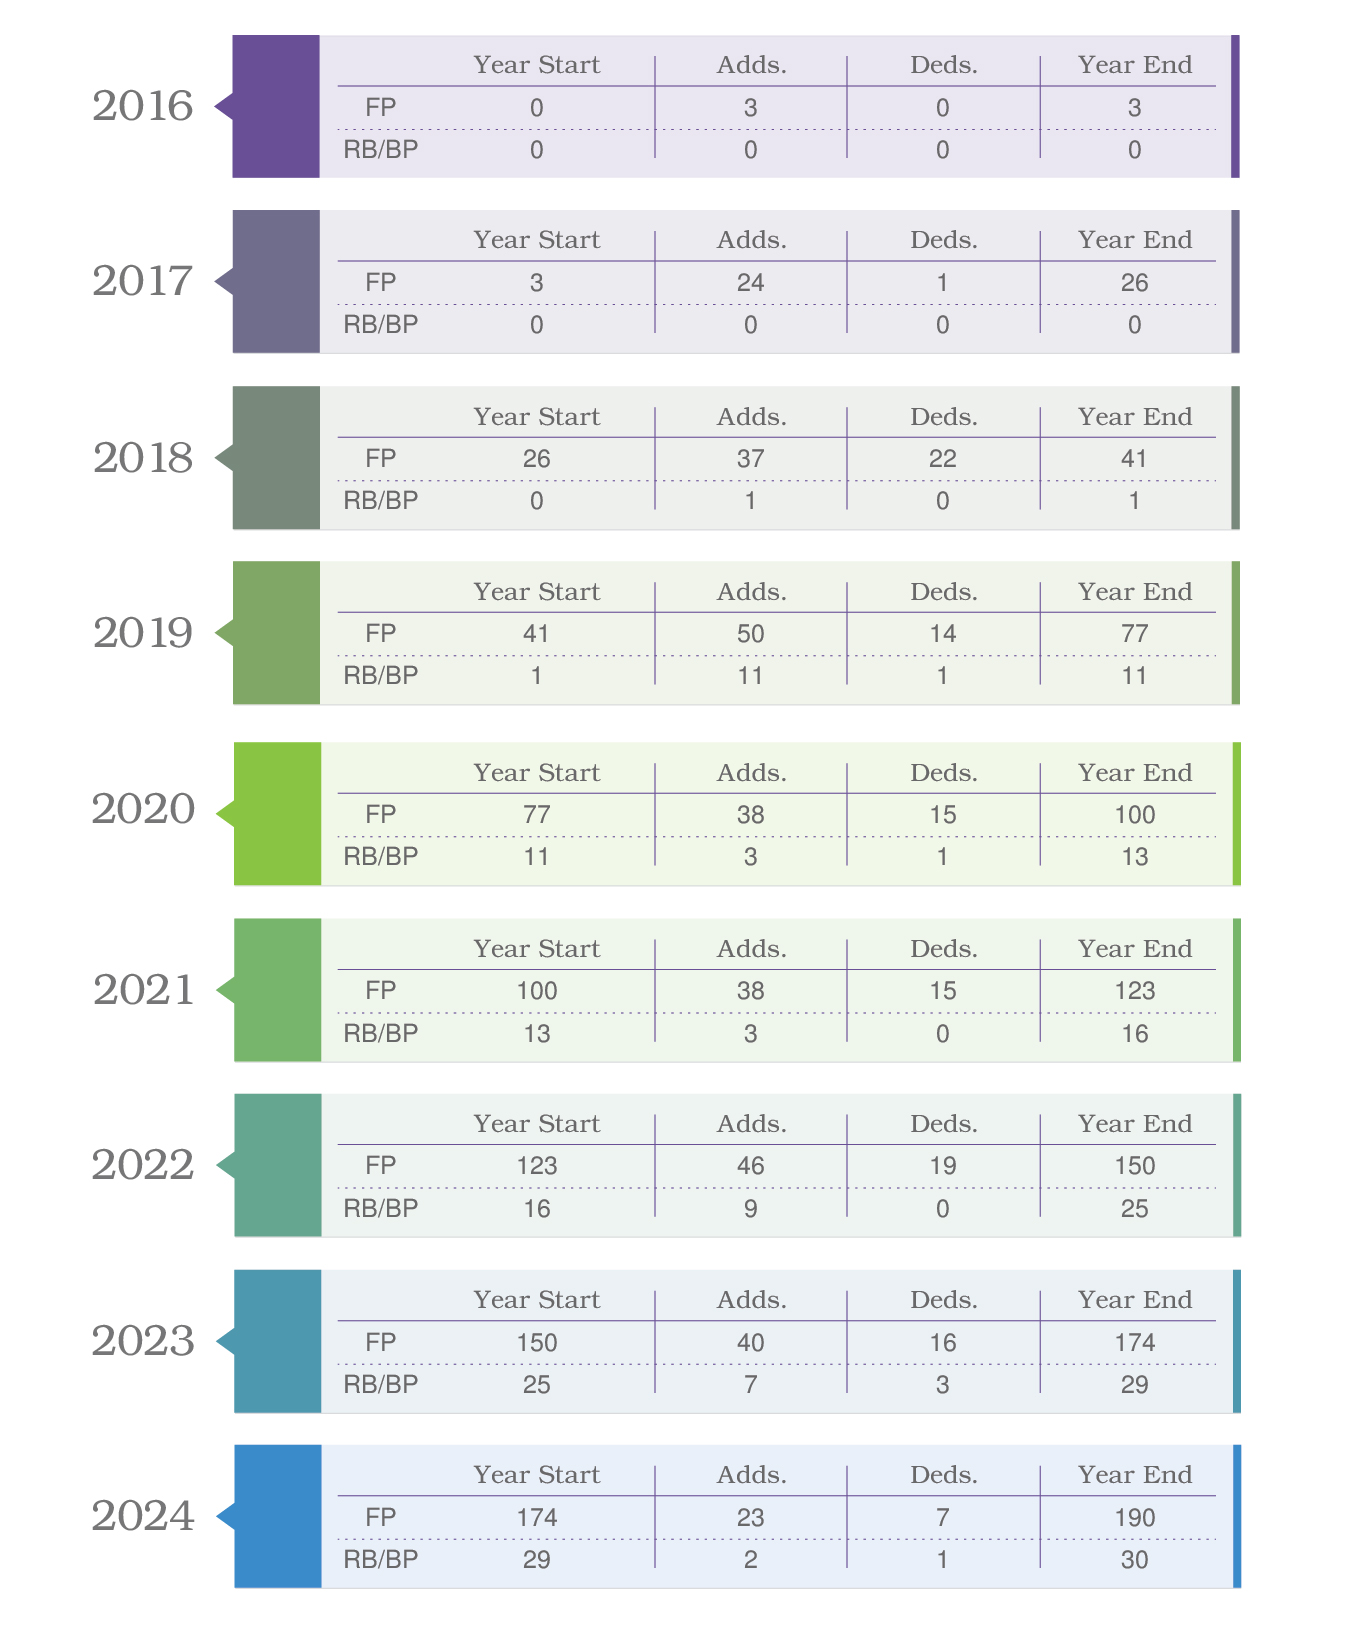
My fountain pen collection has grown with almost embarrassing rapidity, from just 3 in 2016 to 26 in 2017, 41 in 2018, 77 in 2019, 100 in 2020, 123 in 2021, 150 in 2022, 174 in 2023, and 190 as of today. The rollerball/ballpoint collection has grown much more slowly, starting from 1 in 2018 to 11 in 2019, 13 in 2020, 16 in 2021, 25 in 2022, 29 in 2023, and 30 as of today.
NOTE: The rest of the infographics below are based on the 160 pens that are currently in my possession, excluding the ones that I have for sale.
Pen Origin
It’s always fun to see where my pens are from. I’m still interested in finding pen makers in South America and Australia so I can have pens from every permanently inhabited continent.
I looked at pen origin differently this year, separating it into indie makers (36% of my collection) and mainstream manufacturers (64% of my collection).

My indie pens have come from Poland (1.72%), Canada (1.72%), the UK (6.90%), Russia (6.90%), South Africa (17.24%), and the USA (65.52%). My mainstream pens are from the UK (0.98%), Russia (2.94%), China (2.94%), the USA (9.80%), Germany (10.78%), Armenia (10.78%), Italy (11.76%), Taiwan (18.63%), and Japan (31.37%).
Pen Distribution
In opposition to pen origin, I didn’t separate pen distribution this year. Rather than overlapping distribution types, I pulled out exclusives this year. Allow me to provide my definition of some terms I’ve used:
- Normal: These are standard editions and pens that indie makers make as part of their normal work, as opposed to pens that are custom ordered.
- Special Edition: If a pen edition will be retired sooner than a standard edition, but is not numbered, I call it a special edition.
- Limited Edition: A limited edition pen is basically a numbered special edition. You know how many pens the edition is limited to. This shouldn’t be confused with Retro 51’s open numbered edition, where each pen is numbered, but there is no pre-set limit to the total number of pens produced.
- Custom: A pen I custom-ordered to my specifications.
- After Market (A.M.): This is a pen that has after-market customization, like Bokumondoh does.
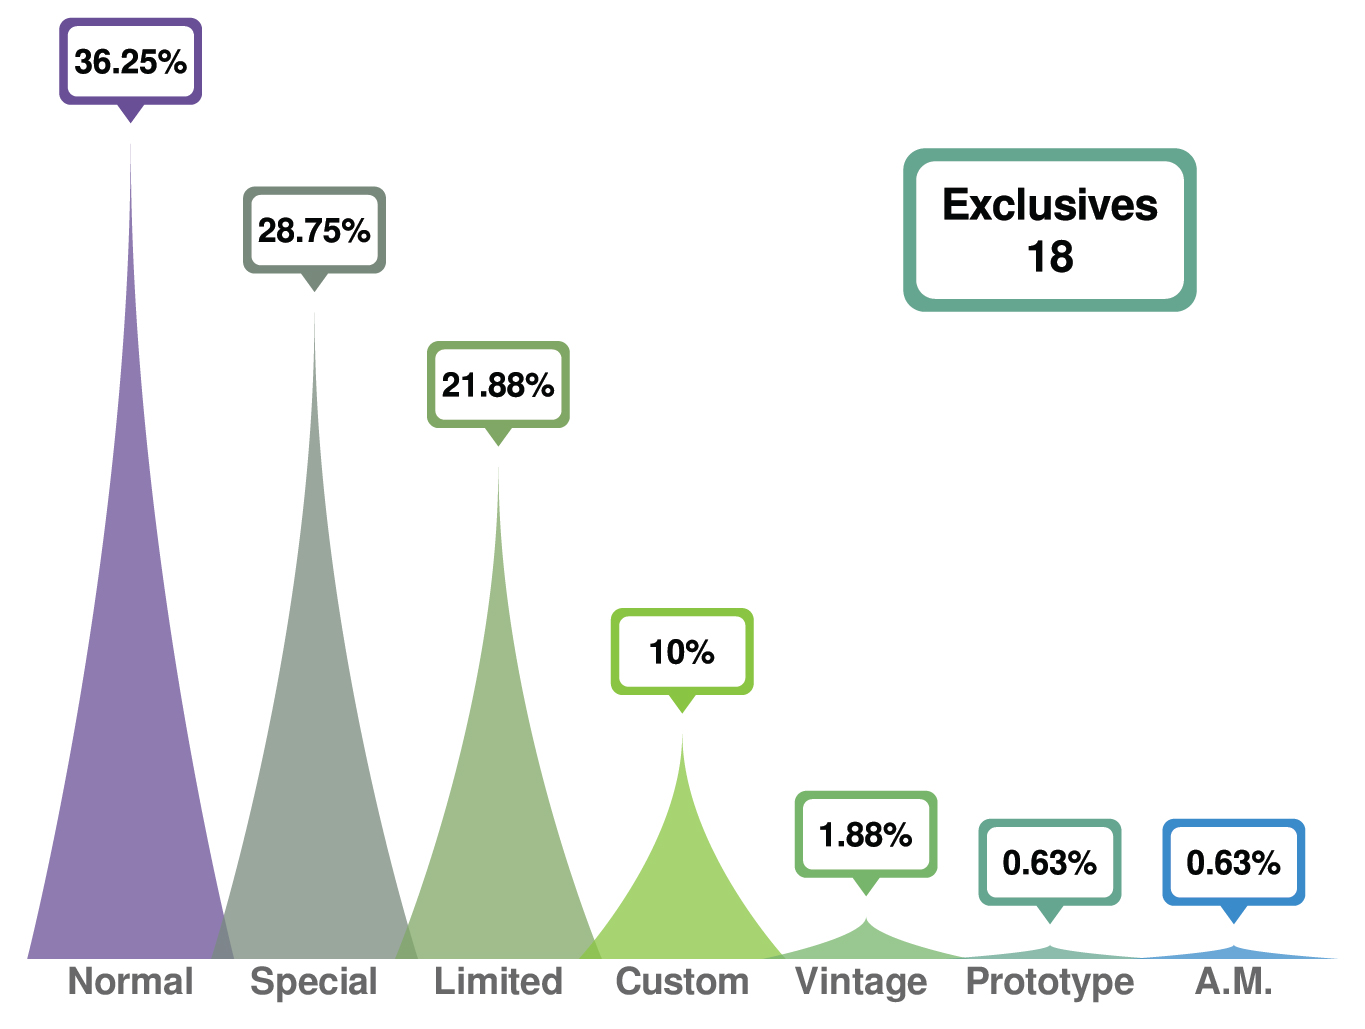
My collection breaks down to 36.25% normal editions, 28.75% special editions, 21.88% limited editions, 10% custom orders, 1.88% vintage pens — I think they’re all normal editions, but I’m not positive, so I pulled them out separately — 0.63% prototypes, and 0.63% pens with after market modifications. Among these different pens, 18 were exclusive to a specific store or distributor.
Pen Color
When referring to color, I’m thinking of the dominant color of the pen. For example, the Nahvalur Original Plus: Halloween is orange. Pens that have don’t have an obviously dominant color are classified as multicolor. Jonathan Brooks’ materials are an excellent example of this.

I have 16 red or pink pens, 8 orange pens, 4 gold or yellow pens — definitely need to increase that — 11 green ones, 12 teal or turquoise, 9 blue, 11 purple, 11 brown or copper, 31 black, gray, white, ivory or clear, and 47 multicolor pens.
Nibs
I decided to look at nib modifications and nib width or style for non-modified nibs.
Modifications
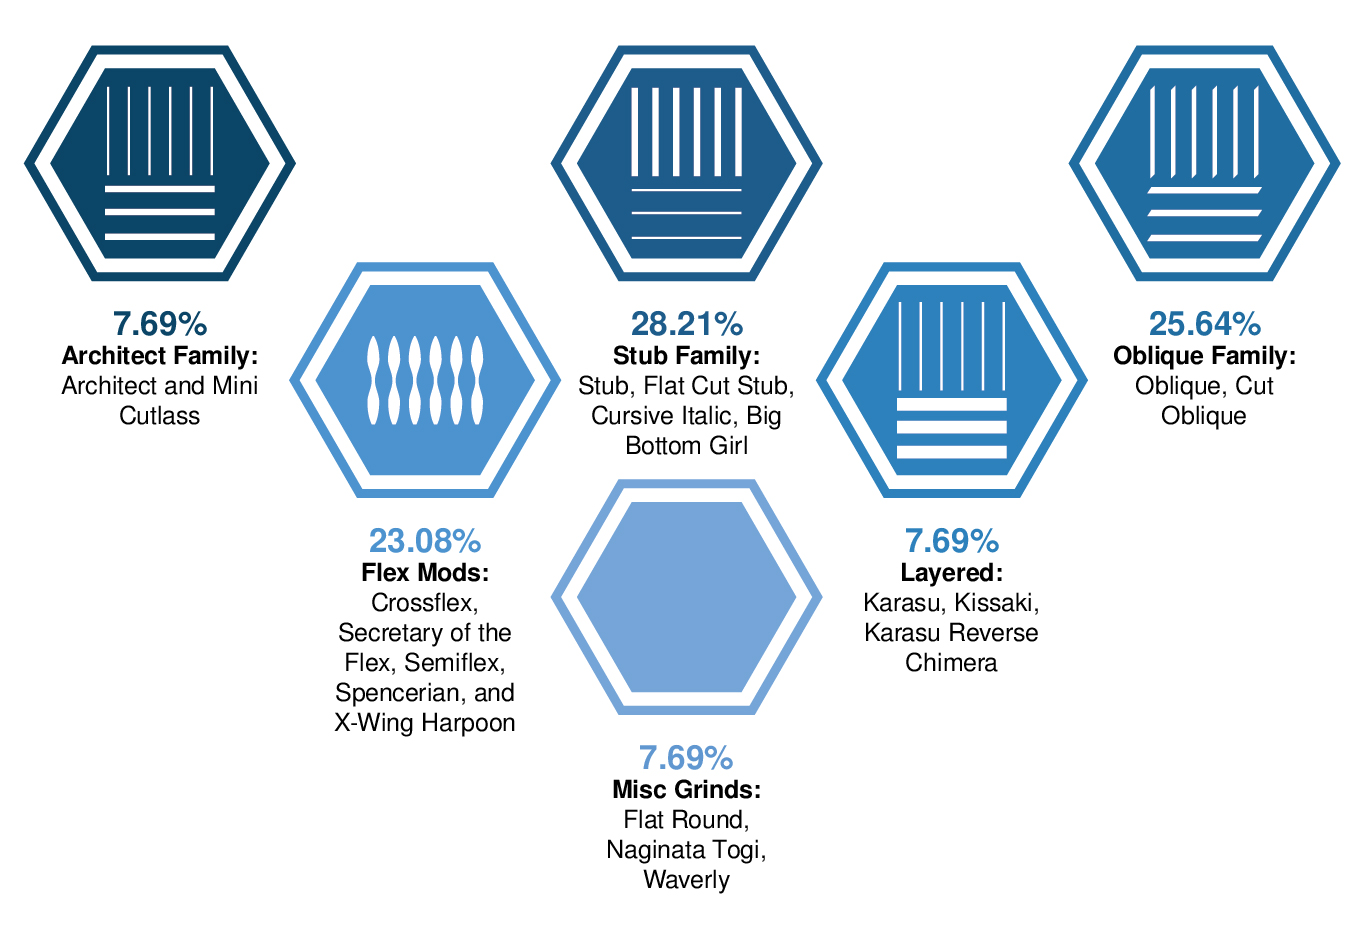
I have nib modifications in five major families, with a few miscellaneous grinds. 7.69% are in the architect family including standard architect and mini cutlass grinds. 28.21% are in the stub family including standard stub, flat cut stub, cursive italic, and big bottom girl. 25.64% are in the oblique family including ground and cut obliques. 23.08% are flex modifications including crossflex, secretary of the flex, semiflex, spencerian, and x-wing harpoon. 7.69% are 2-layer nibs including karasu, kissaki, and karasu reverse chimera. Finally, the remaining 7.69% are miscellaneous grinds including a flat round — AKA monoline — naginata togi, and waverly.
Nib Width or Style
The nibs counted toward the values below are only ones that remain unmodified. This may be a mainstream pen, like the Custom 74, or an indie-made pen that came with a nib that I have yet to modify. I have not included any extra nibs I’ve purchased separate from pens.

It’s pretty easy to see what my nib width preference is. 12.5% are EF — I’m surprised this isn’t higher — a whopping 39.38% are F —the highest individual percentage — FM nibs account for 1.25%, M nibs make up 31.25% — the second highest individual percentage — and 2.5% are B — which I only have from buying pens secondhand. Then we have unique stock nibs, including 3.13% that are stub, 0.63% that are oblique, and 3.75% that are flexible. Then there are 1.25% without a size marking, and 4.38% of pens that I purchased without a nib.
What did you think of the stats I included this year? Is there anything you wish I’d included? Let me know in the comments! I’d love to hear from you.
Thanks for reading to the end, I hope you enjoyed my post. Make sure to subscribe to my blog or follow me on Instagram so you don’t miss any posts. I generally post at least once a week.
Wow, what a beautiful and comprehensive presentation of data! Thank you, Rachel, for sharing your collection. I’ll definitely update my spreadsheet with some of your data points. I find the color data particularly insightful, and I often think about my own preferences. I prefer silver trim, which limits my options a bit. I suppose most pens come with gold (60-70%), so I’ll add that column to my spreadsheet. Thanks again for sharing!
I’m happy this gave you some ideas! If you look back at the 2021 and 2022 Stas, I have even more data included.You may find yourself surprised on trim. The majority of my pens with trim details have silver, I think. Not through preference, necessarily, but simply what they come with.
Thx for posting and the effort involved! Fascinating overview!
Fascinating to read! I admire your willingness to do this project.